 {{ cadans }}
Welcome to Bike Speed Gear Calculator
Have you ever cycled up a hill that was too steep and too challenging for you? This tool helps you solve this problem.
First, based on your power, we will calculate the speed you will achieve. Then, by choosing the right gears, you can set a comfortable cadence.
Speed calculation: power, weight, gradient, and air resistance
Enter the necessary data: your power output for a specific duration, total weight (including yourself, bike, clothing, and water bottles). We’ll ask about the steepness of the intended gradient, and choose the air resistance based on an image. The result? A calculation of the speed you’ll achieve on that climb.
Cadence optimization: gears and tire size
Your cycling experience isn’t just about speed; it’s also about finding the perfect cadence. Choose your tire size and adjust your gears. The optimal cadence varies for everyone; the green zone is generally considered comfortable, so adjust the gears to avoid the red zone.
Settings
Power
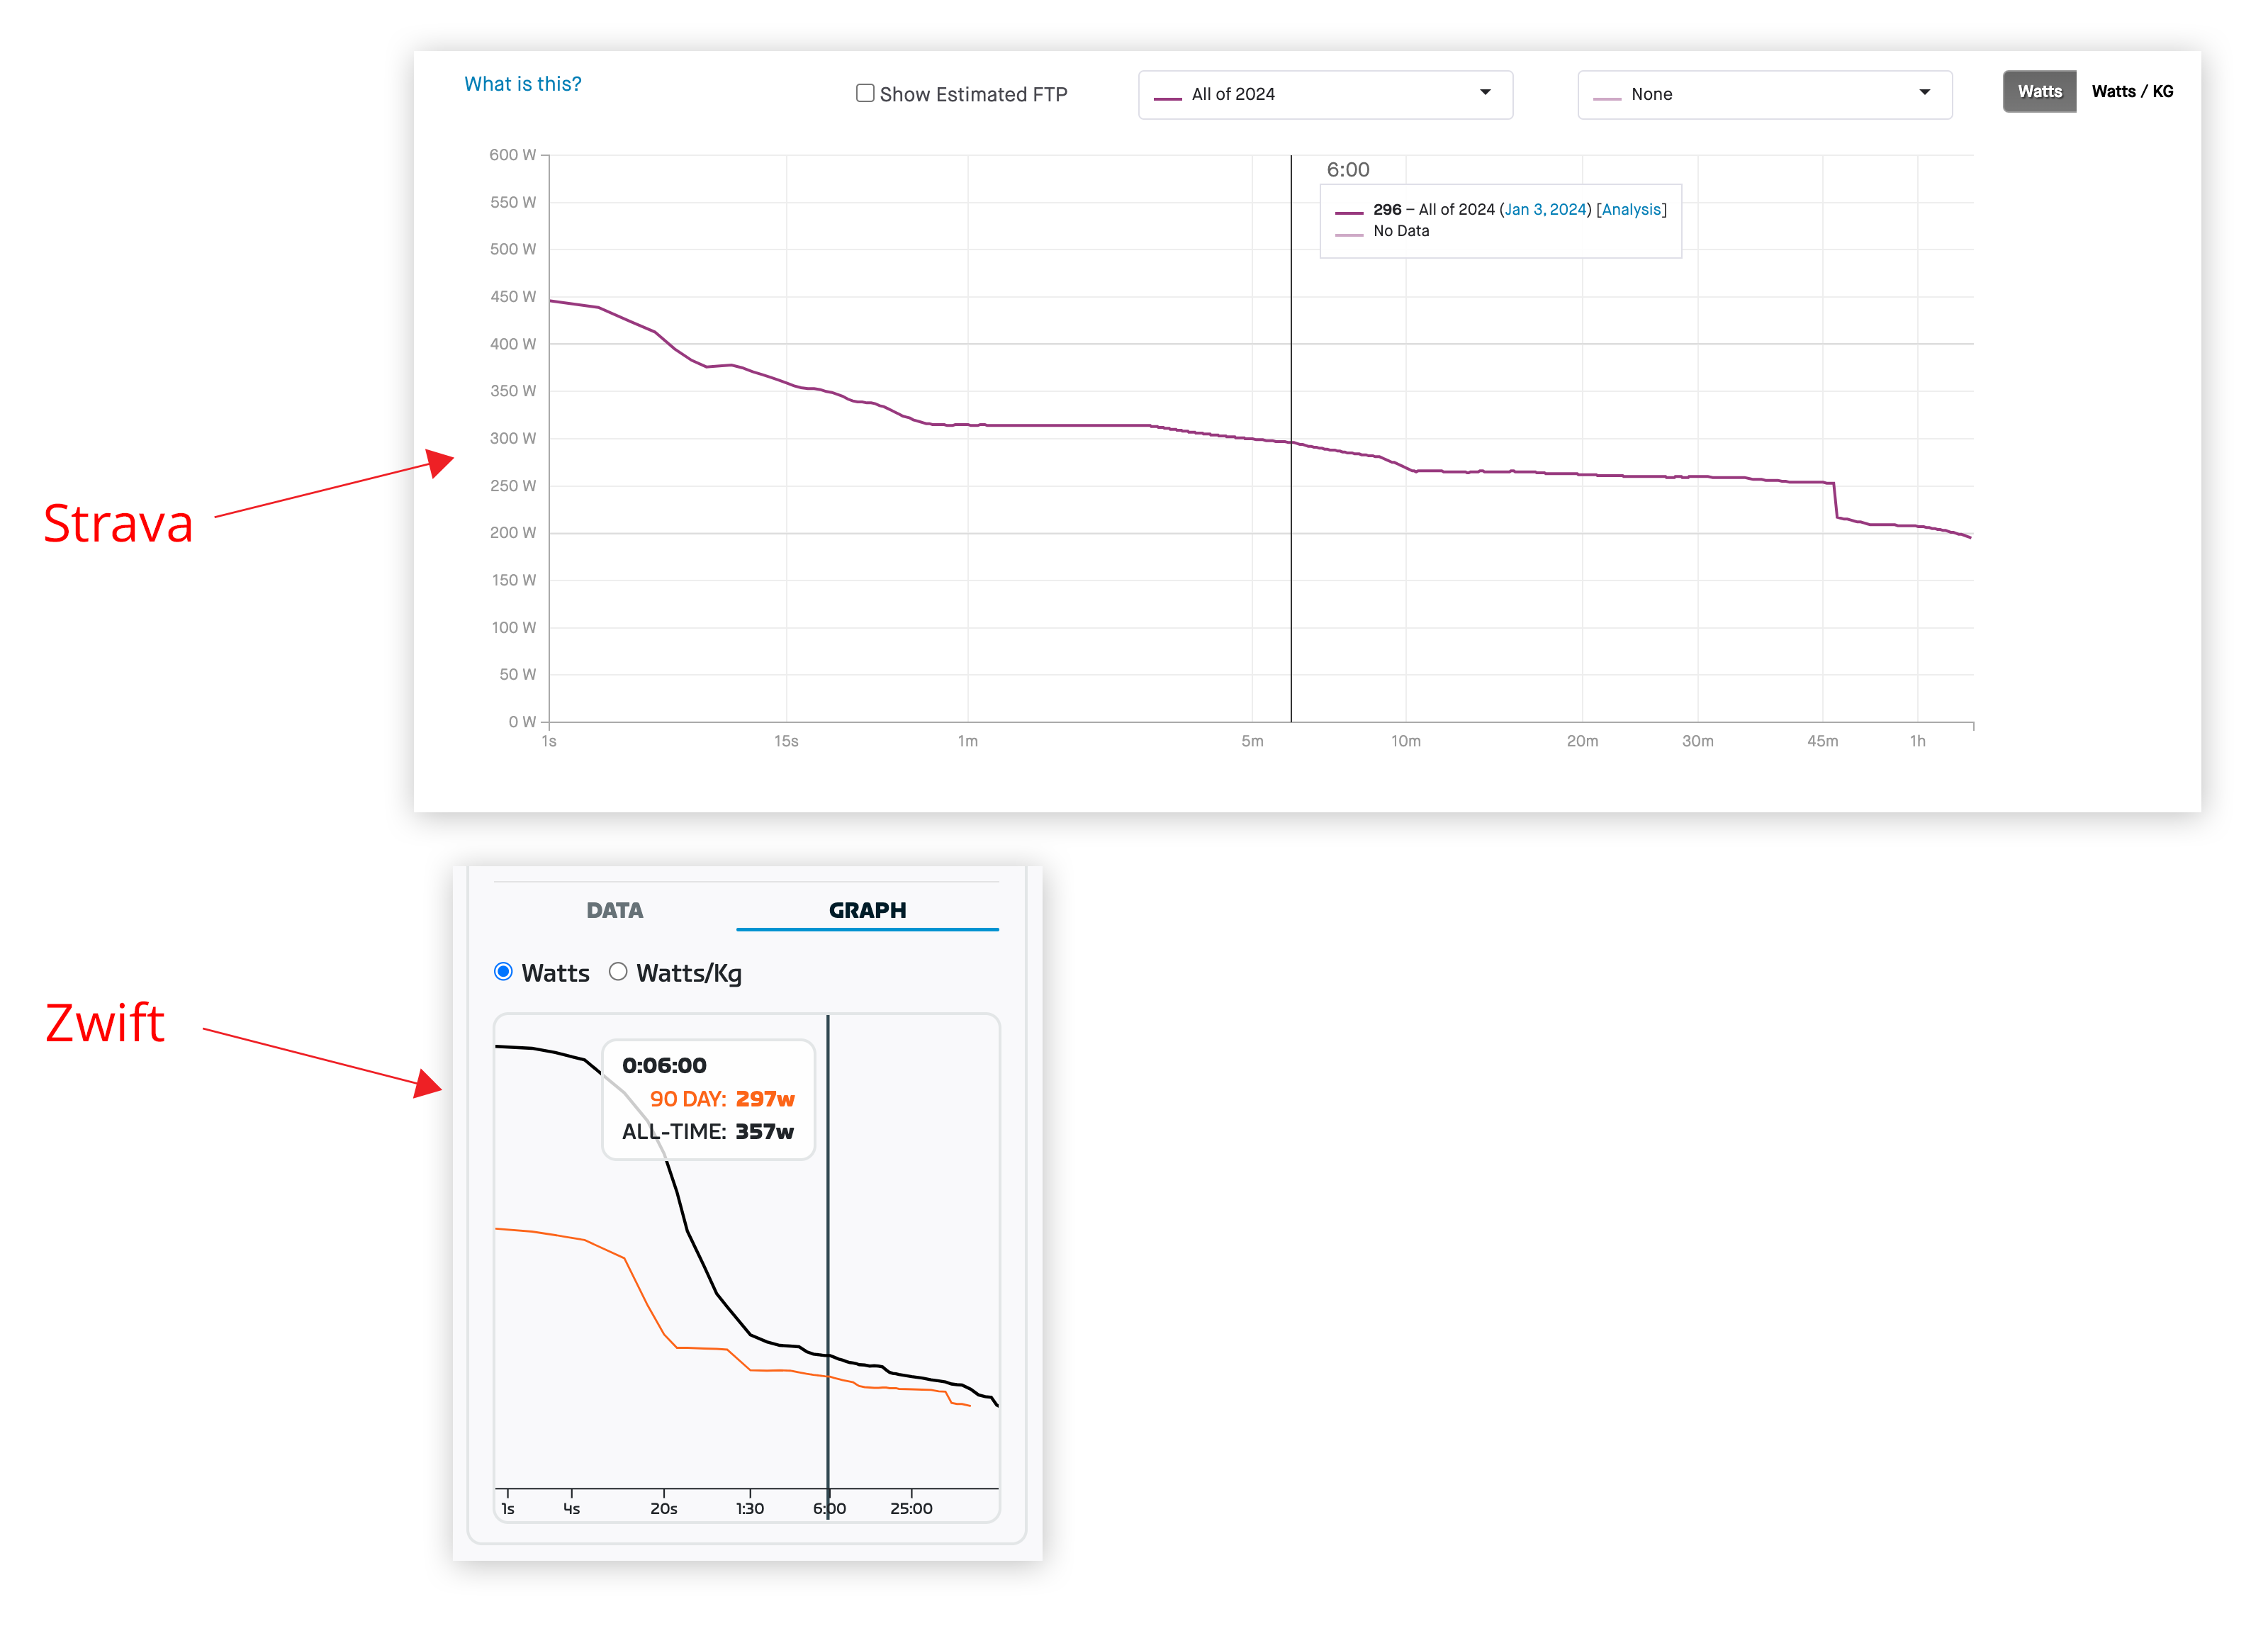
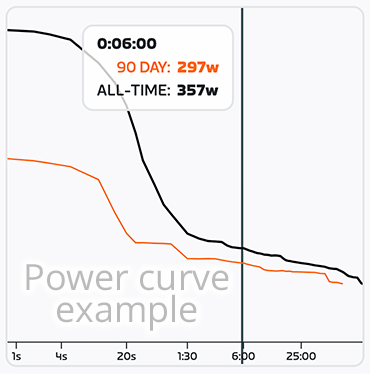 The first step is determining your power output for the intended (climbing) duration. Use tools like the paid versions of Strava or Zwift to view your power curve. Estimate the required time and note the corresponding power value.
Weight
Specify the total weight, including yourself, your bike, clothing, and water bottles.
Gradient
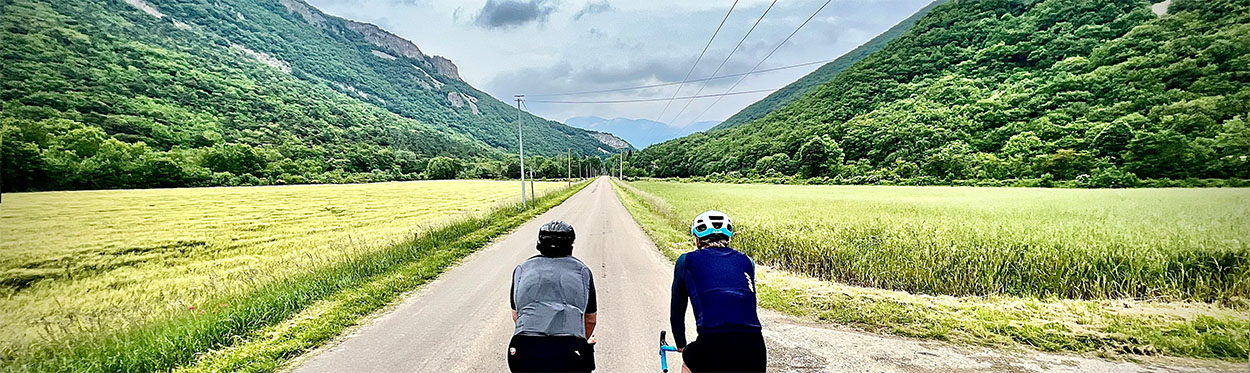
Base the gradient on the longest and steepest parts of your climb so that you have the right gears for those sections. For example, a climb like Mont Ventoux from Malaucéne has an average gradient of 7.5 percent but includes longer sections of 10, 11, and even 12 percent. If you want to handle these sections well, consider that percentage.
Air resistance
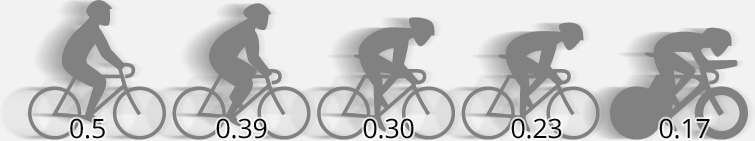
This is represented by a value called the coefficient of drag (CD, in Dutch CW), combined with the frontal area (A). To simplify, we provide an image with common CDA values for cyclists, ranging from casual to professional levels.
Speed & cadence
Once you’ve entered your data (Power, Weight, Gradient, and Air Resistance), this tool will calculate your speed.
The idea is to adjust your gears so that your cadence, the pace at which you pedal (RPM), falls into the green zone and is perceived as comfortable.